Solve optimization problems in Jupyter Notebooks#
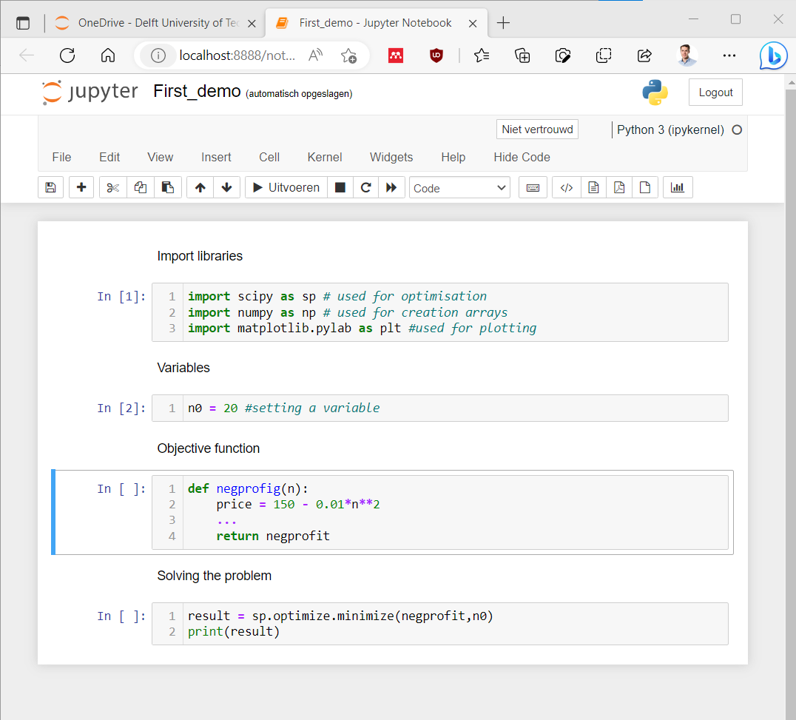
For this course, our Jupyter Notebooks follow the same structure for all problems by defining the following sections:
Import libraries
Define variables
Define objective function
Define constrain function(s) if needed
Solve the problem
Postprocess results if needed

Fig. 5 General layout Jupyter Notebooks in this course#
The structure is shown for an example which will be treated in-depth later.
Import libraries#
Python cannot do optimization on its own, therefore we make use of separate packages which are installed with Anaconda:
scipyused for optimizationnumpyused for matrix algebramatplotlibused for plotting
Libraries are imported with import ... as ... which directly abbreviates the packages for later use.
import scipy as sp
import numpy as np
import matplotlib.pylab as plt
Define variables#
In this part of the notebook we can store all our variables in the form of integers, floats and arrays.
n0 = 20
Define objective function#
In this part we define our constraint function as a callable with def ...: ... return ...
These functions can contain multiple lines of calculation but should return one values which is minimized.
def negprofit(n):
    price = 150 - 0.01 * n**2
    revenues = price * n
    totalcost = 75 * n
    profit = revenues - totalcost
    return -profit
Define constraint function#
Similar to the objective function, the constrain function(s) can be defined, which may return multiple values
Solve the problem#
Making using of the scipy-library, the problem is solved. Using print, the result is shown
result = sp.optimize.minimize(negprofit,n0)
print(result)
  message: Optimization terminated successfully.
  success: True
   status: 0
      fun: -2499.9999999998727
        x: [ 5.000e+01]
      nit: 8
      jac: [ 0.000e+00]
 hess_inv: [[ 3.503e-01]]
     nfev: 22
     njev: 11
Postprocess results#
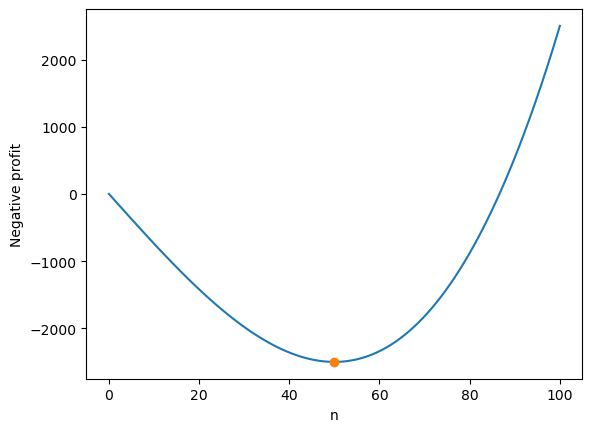
If needed, we can postprocess the result or analyse the problem in another way
# checking the results with exhaustive search

n_range = np.linspace(0,100,100)
negprofit_result = negprofit(n_range)
plt.plot(n_range,negprofit_result)
plt.plot(result.x,result.fun,'o')
plt.xlabel('n')
plt.ylabel('Negative profit');

