3.4. Histograms#
A histogram is a graphical representation of the distribution of a dataset. It consists of a set of rectangular bars, where the width of each bar represents a range of values, and the height of each bar represents the frequency or count of data points falling within that range. Histograms are commonly used to visualize the distribution and frequency of data in various fields, including geosciences. For example, the study of earthquakes often involves analyzing the distribution of earthquake magnitudes. The magnitudes of earthquakes can provide valuable insights into the frequency and severity of seismic events.
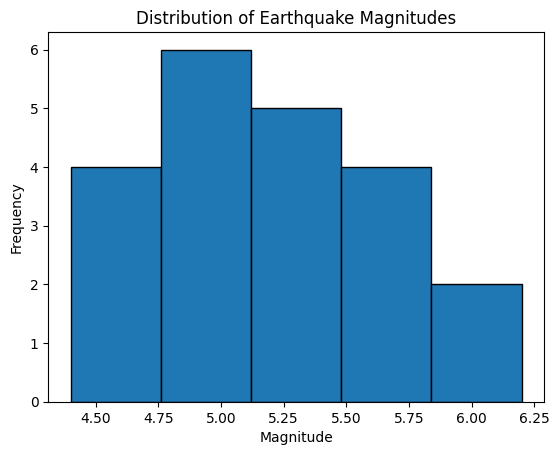
Let’s consider a scenario where we have a dataset containing earthquake magnitudes. We want to visualize the distribution of these magnitudes using a histogram.
earthquake_magnitudes = [4.5, 5.2, 4.8, 5.7, 4.9, 6.2, 5.1,
                        5.5, 4.6, 5.9, 5.3, 4.7, 5.8, 4.4,
                        4.8, 5.1, 5.3, 5.2, 4.9, 5.4, 5.6]

plt.hist(earthquake_magnitudes, bins=5, edgecolor='black')
plt.xlabel('Magnitude')
plt.ylabel('Frequency')
plt.title('Distribution of Earthquake Magnitudes')
plt.show()
Let’s break it down
In the example, we first define the earthquake magnitudes in the earthquake_magnitudes list. We then create a histogram using plt.hist(), where earthquake_magnitudes is the data, and bins=5 specifies the number of bins or bars in the histogram. The edgecolor='black' parameter sets the color of the edges of the bars.
We then set the x-axis label as ‘Magnitude’, the y-axis label as ‘Frequency’, and the title as ‘Distribution of Earthquake Magnitudes’ using the appropriate plt.xlabel(), plt.ylabel(), and plt.title() functions.
Finally, we display the histogram on the screen using plt.show().
The resulting histogram will visualize the distribution of earthquake magnitudes, showing the frequency of magnitudes falling within each bin. This information can help geoscientists understand the distribution and characteristics of earthquakes in the studied region.