3.5. Subplots#
In Python, subplots refer to the division of a single figure into multiple smaller plots or subplots. Each subplot is an independent plot area within the larger figure. Subplots are useful when you want to display multiple plots or visualizations side by side or in a grid-like arrangement.
The subplots() function in the matplotlib library is used to create subplots. It allows you to specify the number of rows and columns in the subplot grid, which determines the overall layout of the subplots.
Here’s an example to help you understand subplots. We will use the dataset of a sample of 100 vehicles corresponding to the 3-axle vehicle type 3C (remember the Maximum bending moment on a simply supported bridge example on numpy section?)
First we will read the data set using pandas
dataset = pd.read_csv("https://raw.githubusercontent.com/"
                "mike-mendoza/Bivariate_NPBN_workshop_files/"
                "a991bc3d9391a92437af1c3d69ae9fdfe6baf6da/"
                "files_pyhton_book_test/V3AX_WIM_BR.csv")
dataset.head()
| A1_kN | A2_kN | A3_kN | D1_m | D2_m | |
|---|---|---|---|---|---|
| 0 | 42.1 | 77.5 | 65.3 | 5.1 | 1.4 |
| 1 | 48.7 | 80.1 | 50.2 | 5.4 | 1.2 |
| 2 | 51.7 | 90.2 | 61.6 | 5.2 | 1.2 |
| 3 | 41.2 | 75.7 | 58.6 | 5.4 | 1.2 |
| 4 | 25.0 | 48.4 | 33.5 | 5.6 | 1.2 |
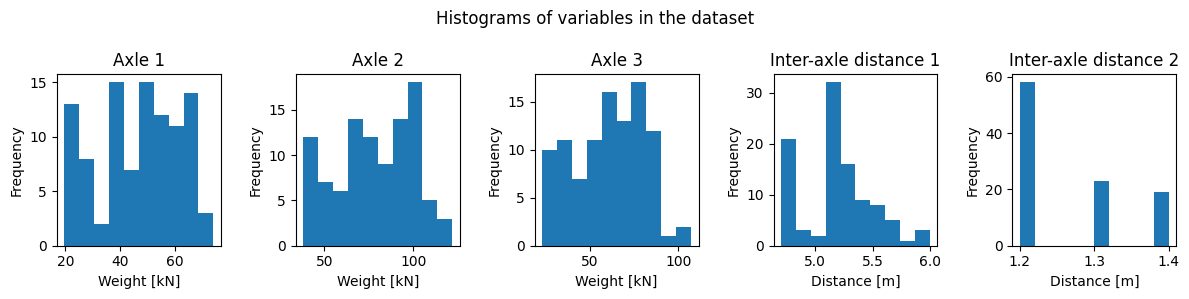
Let’s create one figure with one histogram per colum in the dataset using for loop.
variable_names = ['Axle 1', 'Axle 2', 'Axle 3',
                   'Inter-axle distance 1', 'Inter-axle distance 2']

xlabels =['Weight [kN]', 'Weight [kN]', 'Weight [kN]',
           'Distance [m]', 'Distance [m]']

fig, axes = plt.subplots(nrows=1, ncols=5, figsize=(12,3))
for i,column in enumerate(dataset.columns):
    axes[i].hist(dataset[column])
    axes[i].set_xlabel(xlabels[i])
    axes[i].set_ylabel('Frequency')
    axes[i].set_title(variable_names[i])
plt.suptitle('Histograms of variables in the dataset')
plt.tight_layout()
plt.show()
Let’s break it down
variable_namesis a list containing the names of different variables in a dataset.xlabelsis a list containing the x-axis labels for each histogram.The code creates a figure with 1 row and 5 columns of subplots using
plt.subplots(nrows=1, ncols=5, figsize=(12, 3)).for i, column in enumerate(dataset.columns)initiates a loop that iterates over the columns of the dataset. It uses theenumerate()function to retrieve both the index (i) and the column name (column) at each iteration.It then loops over the columns of the dataset and creates a histogram for each column using
axes[i].hist(dataset[column]).The x-axis label, y-axis label, and title of each subplot are set using
axes[i].set_xlabel(xlabels[i]),axes[i].set_ylabel('Frequency'), andaxes[i].set_title(variable_names[i]), respectively.The super title for the entire figure is set using
plt.suptitle('Histograms of variables in the dataset').plt.tight_layout()adjusts the spacing between subplots.Finally,
plt.show()displays the figure with all the subplots.