5.1. Modules#
5.1.1. Math#
Python’s math module provides a collection of mathematical functions and constants for various numerical operations. These functions are useful for performing mathematical calculations in Python. Here are some commonly used functions from the math module:
The math.sqrt( ) function returns the square root of a number
The math.ceil( ) function returns the smallest integer greater than or equal to a given number
The math.floor( ) function returns the largest integer less than or equal to a given number
The math.pow( ) function returns the value of the first argument raised to the power of the second argument
The math.exp( ) function returns the exponential value of a number
The math.log( ) function returns the natural logarithm of a number
The math.sin( ) function returns the sine of an angle given in radians
The math.cos( ) function returns the cosine of an angle given in radians
The math.radians( ) function converts an angle from degrees to radians
Note: to see what each input a functions can take, press shift+tab or crt+shift+space within function parentheses.
import math

result_sqrt = math.sqrt(16 )
result_ceil = math.ceil(3.2)
result_floor = math.floor(3.9)
result_pow = math.pow(2, 3)
result_exp = math.exp(1)
result_log = math.log(10)
result_sin = math.sin(math.pi/2)
result_cos = math.cos(0)
result_radians = math.radians(180)

print(result_sqrt)
print(result_ceil)
print(result_floor)
print(result_pow)
print(result_exp)
print(result_log)
print(result_sin)
print(result_cos)
print(result_radians)
4.0
4
3
8.0
2.718281828459045
2.302585092994046
1.0
1.0
3.141592653589793
5.1.2. Listing all functions#
A docstring tooltip (like a function explanation box) is like a special helper box that appears when you press a button. It tells you what a function does and how to use it correctly, just like a special box that explains what a magic toy does and how to play with it. The function explanation box helps programmers understand functions better, making programming easier and more enjoyable.There are two very common methods to use this tooltip:
Using the help() function: To access the docstring tooltip using the help() function, you can include it in your Python code followed by the name of the function you want to learn more about. When you run the code, the docstring tooltip will be displayed in the console or output window. For example:
help (math.pow)
Help on built-in function pow in module math:

pow(x, y, /)
    Return x**y (x to the power of y).
Many popular Python IDEs offer built-in support for the docstring tooltip. Inside the parentheses of a function, you can press Shift+Tab or Ctrl+Shift+Space, and the tooltip will appear, providing the function’s documentation. This feature is available in IDEs like PyCharm, Visual Studio Code, and Jupyter Notebook.
5.1.3. Python third-party modules#
Besides built-in modules, there are also modules developed by other people and companies, which can be also used in your code.
These modules are not installed by default in Python, they are usually installed by using the ’pip’ or ’conda’ package managers and accessed like any other Python module.
This YouTube video explains how to install Python Packages with ’pip’ and ’conda’.
5.1.4. numpy#
The numpy module is one of the most popular Python modules for numerical applications. Due to its popularity, developers tend to skip using the whole module name and use a smaller version of it (np). A different name to access a module can be done by using the as keyword, as shown below. The import numpy as np statement imports the NumPy module, allowing us to use its functionalities.
import numpy as np

my_array = np.array([1, 2, 3, 4, 5])
a = np.array([1, 2, 3])
b = np.array([4, 5, 6])
result = a + b
5.1.5. Matplotlib#
Matplotlib is a Python library widely used for creating visualizations and plots. It provides a simple and flexible way to display data in the form of graphs, charts, and other visual representations. It is commonly used in scientific and data analysis applications.
To use Matplotlib, you need to follow these steps:
Importing Matplotlib: Start by importing the Matplotlib library in your Python program using the import statement. This makes the Matplotlib functions and classes available for use.
Creating a Figure and Axes: Next, create a figure and axes objects. The figure represents the entire image or window where your plot will be displayed. The axes represent the coordinate system within the figure where your plot will be drawn.
Plotting Data: Now, use the axes object to plot your data (plt.plot() function is the most commonly used type of plot). You can choose from various plot types like line plots, scatter plots, bar plots, etc., depending on the nature of your data.
Customizing the Plot: You can customize the appearance of your plot by adding labels, titles, legends, adjusting colors, and more. This helps in making the plot more informative and visually appealing.
Displaying the Plot: Finally, you can display your plot by using the plt.show() function.
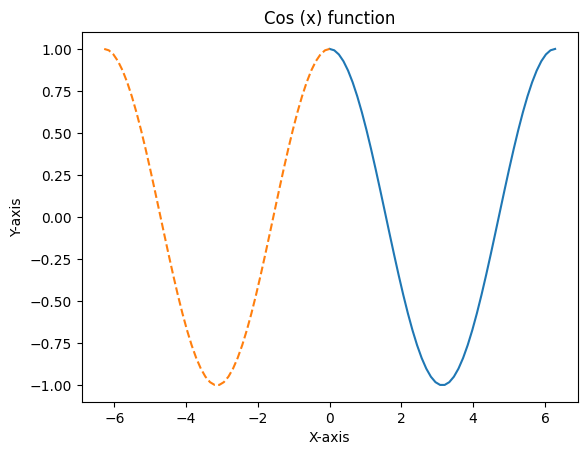
Here is a simple example:
import matplotlib.pyplot as plt


x = np.linspace(0, 2 * np.pi, 50)
y = np.cos(x)

x2 = np.linspace(0, -2 * np.pi, 50)
y2 = np.cos(x2)

fig, ax = plt.subplots()

ax.plot(x, y)
ax.plot(x2, y2, linestyle ='--')

ax.set_xlabel('X-axis')
ax.set_ylabel('Y-axis')
ax.set_title('Cos (x) function')
plt.show()
5.1.6. Loading Python files as modules#
Finally, you can also load your own (or somebody else’s) Python files as modules. This is quite helpful, as it allows you to keep your code projects well-structured without the need to copy and paste everything.
In order to import another *.py file as a module, you only need to have that file and your Notebook file in the same directory and use the import keyword. More info on this here.