3.1. Simple plot#
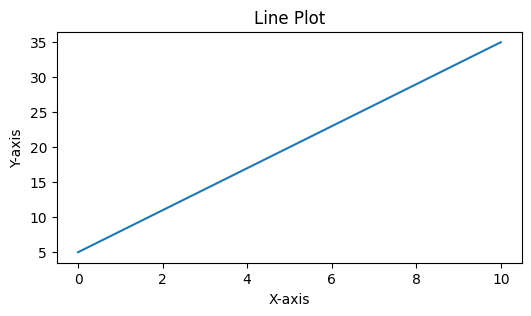
Let’s start by creating a simple line plot of the equation \(y=3x+5\). We will use numpy to create an array which acts as our x-axis
x = np.linspace(0,10)
y = 3*x + 5

plt.figure(figsize=(6,3))
plt.plot(x, y)
plt.xlabel('X-axis')
plt.ylabel('Y-axis')
plt.title('Line Plot')
plt.show()
Let’s break it down
Here’s a breakdown of what each line does:
x = np.linspace(0, 10): This line generates a sequence of evenly spaced numbers between 0 and 10.np.linspace()creates an array of numbers with a specified start and end point.y = 3*x + 5: This line calculates the values for the y-axis based on the values of x. It uses a simple equation3*x + 5, which means each y-value is obtained by multiplying the corresponding x-value by 3 and adding 5.plt.figure(figsize=(6,3)): This line creates a new figure (or plot) with a specified size. Thefigsizeparameter sets the width and height of the figure. In this case, the width is 6 units and the height is 3 units.plt.plot(x, y): This line plots the x and y values on the figure. It takes the x and y values as input and connects them with a line.plt.xlabel('X-axis'): This line sets the label for the x-axis of the plot to ‘X-axis’.plt.ylabel('Y-axis'): This line sets the label for the y-axis of the plot to ‘Y-axis’.plt.title('Line Plot'): This line sets the title of the plot to ‘Line Plot’.plt.show(): This line displays the plot on the screen.plt.show()is a function that shows the plot that has been created.