Eendimensionale voorbeelden#
import sympy as sp
import numpy as np
from sympy import symbols
E, I = symbols('E, I')
x = symbols('x')
a = symbols('a')
sf = sp.SingularityFunction
import matplotlib.pyplot as plt
# Voorbeeld 1
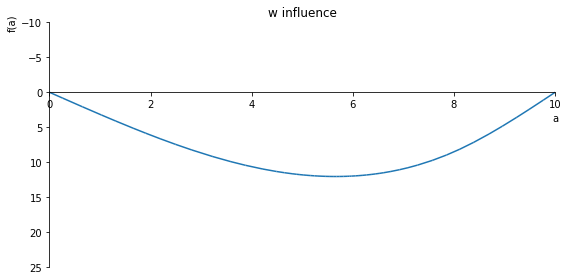
w_influence = (-1/6)*(1/10)*sf(10, a, 1)*sf(x, 0, 3) + 1/6*sf(x, a, 3) - (1/6)*(1 - (1/10)*sf(10, a, 1))*sf(x, 10, 3) - (-(5/3)*sf(10, a, 1) + (1/60)*sf(10, a, 3))*x
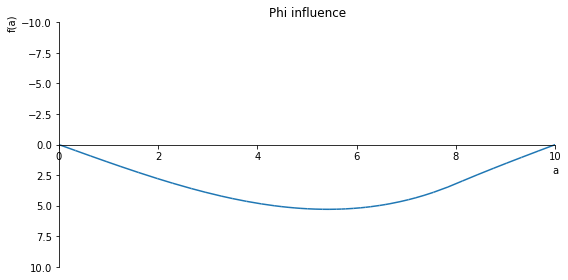
phi = sp.diff(w_influence, x)*-1
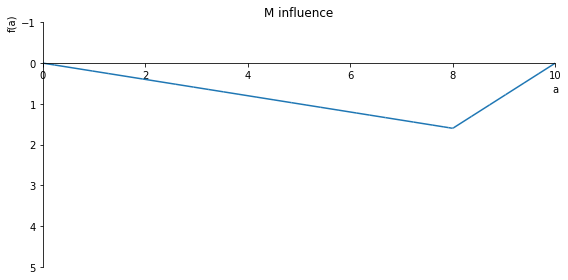
M = sp.diff(phi, x)
V = sp.diff(M, x)

x_value = 8
a_value = 5

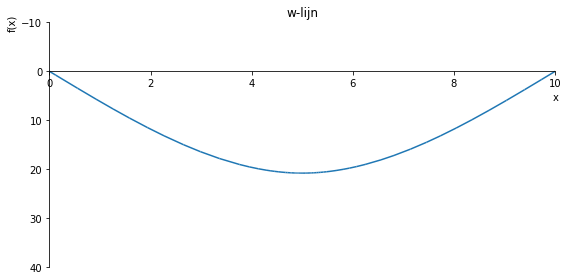
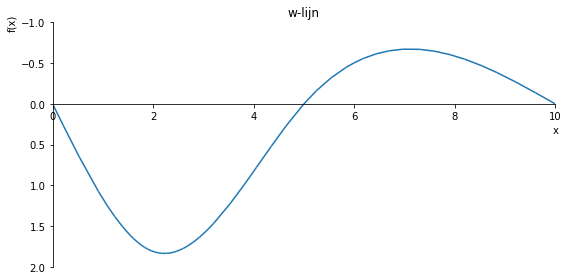
sp.plot(w_influence.subs(a, a_value), ylim=(40, -10), xlim=(0, 10), size=(8, 4), title='w-lijn')
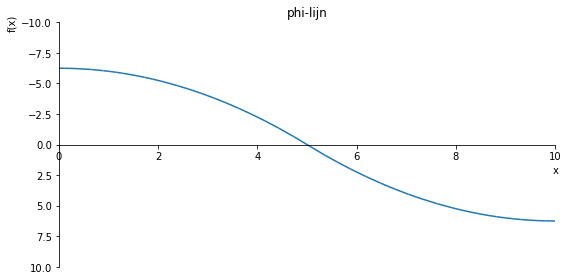
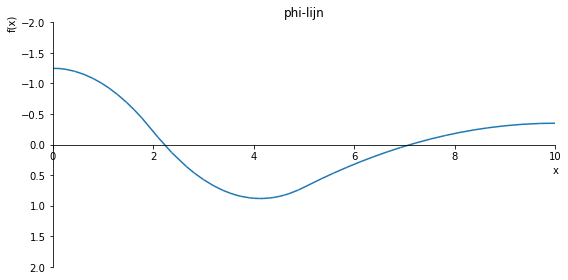
sp.plot(phi.subs(a, a_value), ylim=(10, -10), xlim=(0, 10), size=(8, 4), title='phi-lijn')
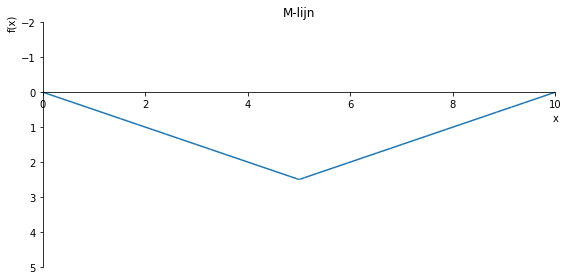
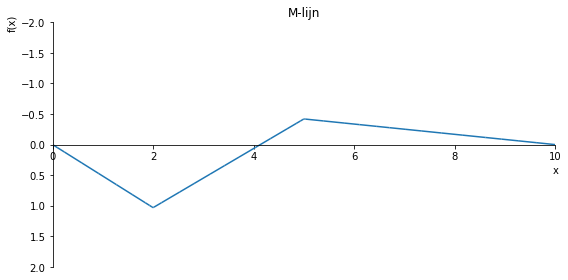
sp.plot(M.subs(a, a_value), ylim=(5, -2), xlim=(0, 10), size=(8, 4), title='M-lijn')
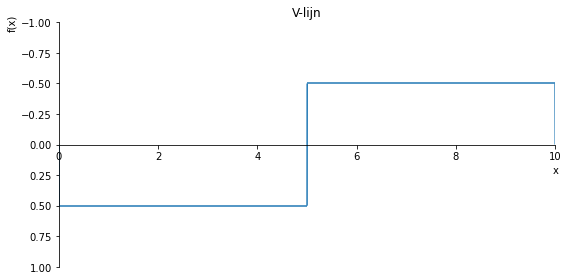
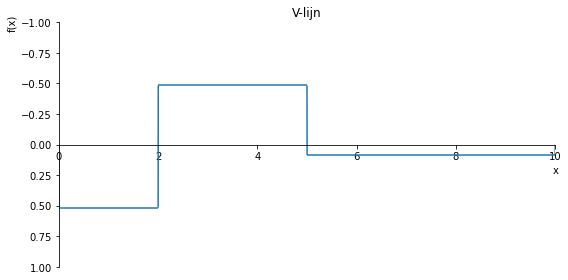
sp.plot(V.subs(a, a_value), ylim=(1, -1), xlim=(0, 10), size=(8, 4), title='V-lijn')

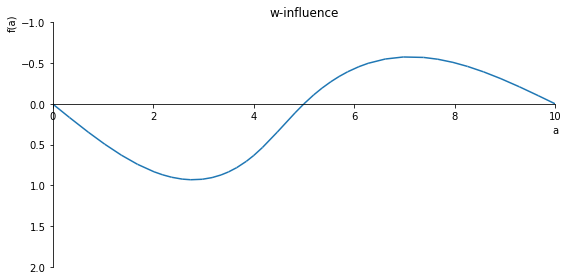
sp.plot(w_influence.subs(x, x_value), ylim=(25, -10), xlim=(0, 10), size=(8, 4), title='w influence')
sp.plot(phi.subs(x, x_value), ylim=(10, -10), xlim=(0, 10), size=(8, 4), title='Phi influence')
sp.plot(M.subs(x, x_value), ylim=(5, -1), xlim=(0, 10), size=(8, 4), title='M influence')
sp.plot(V.subs(x, x_value), ylim=(1, -1), xlim=(0, 10), size=(8, 4), title='V influence')

Av_inlfuence = (1/10)*sf(10, a, 1)
sp.plot(Av_inlfuence, ylim=(1, -1), xlim=(0, 10), size=(8, 4), title= 'Av-influence')
Bv_inlfuence = (1 - (1/10)*sf(10, a, 1))
sp.plot(Bv_inlfuence, ylim=(1, -1), xlim=(0, 10), size=(8, 4), title='Bv-influence')


plt.show()
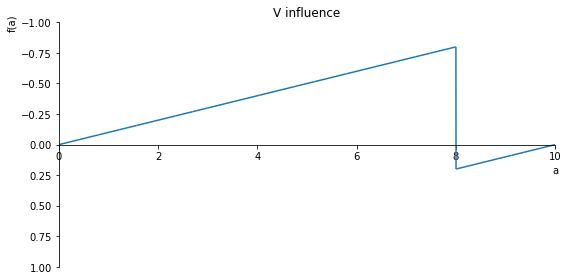
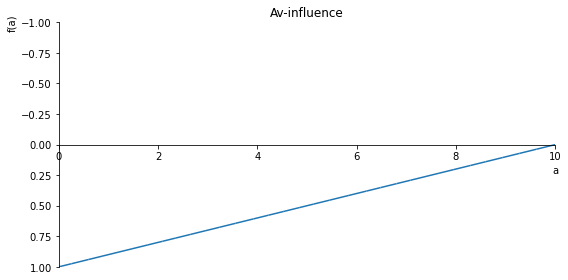
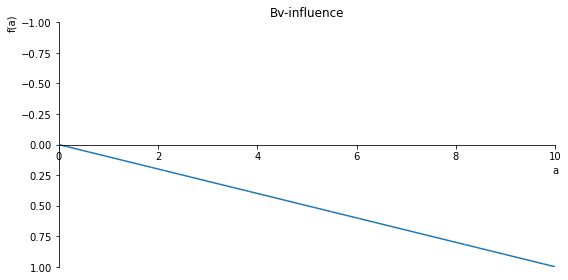
# voorbeeld 2.
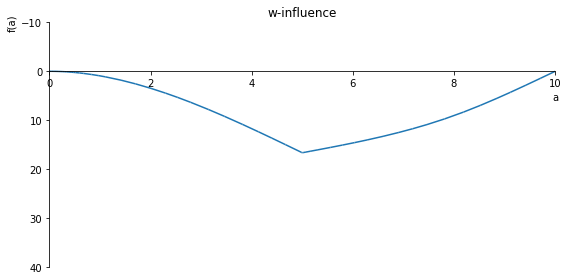
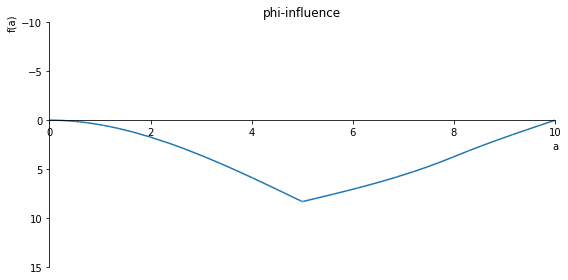
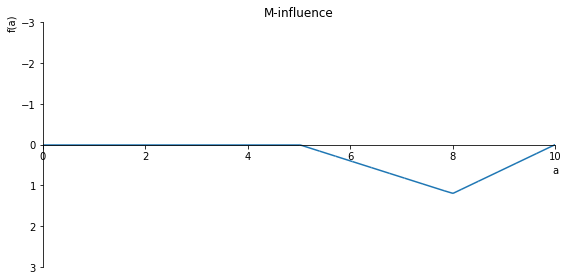
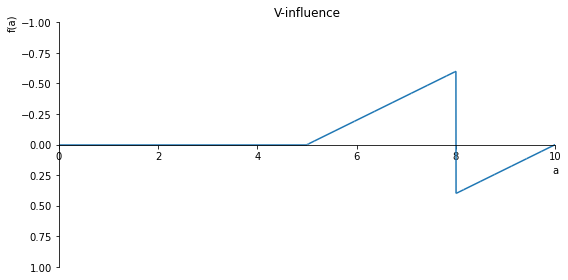
w_influence = (-1/6)*((-sf(5, a, 1) + sf(10, a, 1))/5)*sf(x, 0, 3) + (1/2)*(-2*sf(5, a, 1)+sf(10, a, 1))*sf(x, 0, 2) + 1/6*sf(x, a, 3) + ((20/3)*(-sf(5, a, 1) + sf(10, a, 1)) - 20*(-sf(5, a, 1) + (1/2)*sf(10, a, 1)) - (1/30)*sf(10, a, 3))*sf(x, 5, 1) - (1/6)*(1 - ((-sf(5, a, 1) + sf(10, a, 1))/5))*sf(x, 10, 3)
phi = sp.diff(w_influence, x)*-1
M = sp.diff(phi, x)
V = sp.diff(M, x)

x_value = 8
a_value = 5

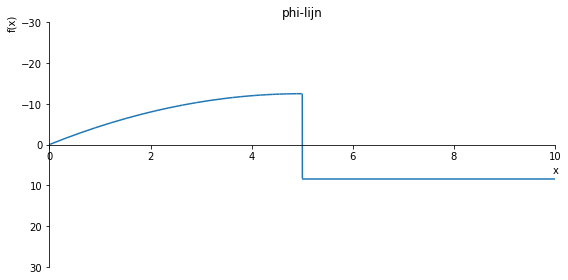
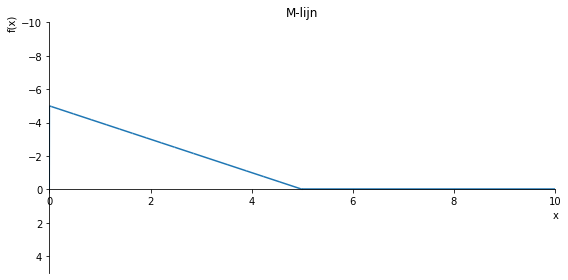
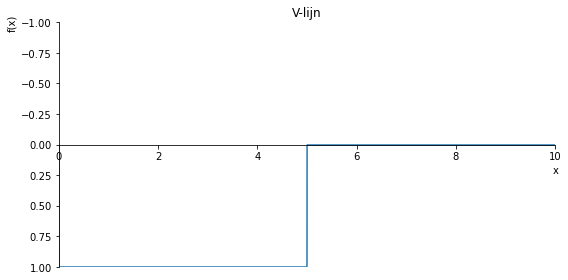
sp.plot(w_influence.subs(a, a_value), ylim=(100, -10), xlim=(0, 10), size=(8, 4), title='w-lijn')
sp.plot(phi.subs(a, a_value), ylim=(30, -30), xlim=(0, 10), size=(8, 4), title='phi-lijn')
sp.plot(M.subs(a, a_value), ylim=(5, -10), xlim=(0, 10), size=(8, 4), title='M-lijn')
sp.plot(V.subs(a, a_value), ylim=(1, -1), xlim=(0, 10), size=(8, 4), title='V-lijn')


sp.plot(w_influence.subs(x, x_value), ylim=(40, -10), xlim=(0, 10), size=(8, 4), title='w-influence')
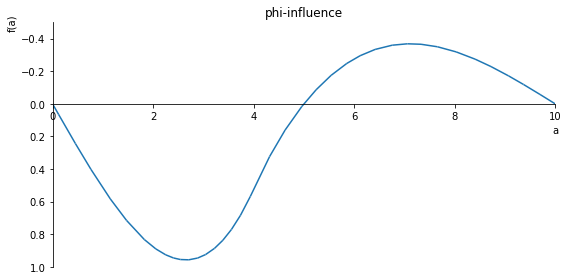
sp.plot(phi.subs(x, x_value), ylim=(15, -10), xlim=(0, 10), size=(8, 4), title='phi-influence')
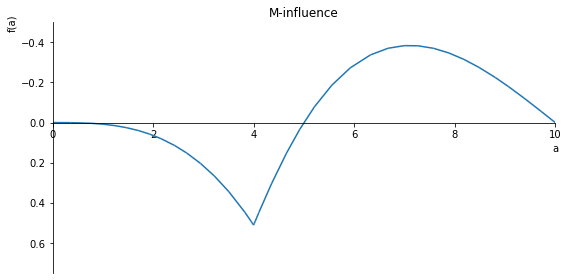
sp.plot(M.subs(x, x_value), ylim=(3, -3), xlim=(0, 10), size=(8, 4), title='M-influence')
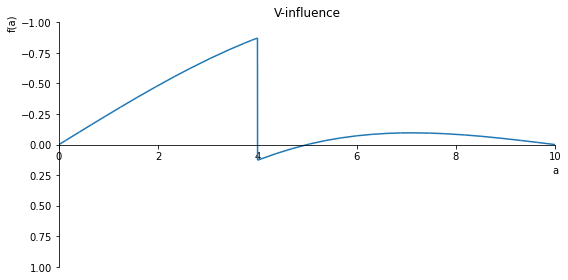
sp.plot(V.subs(x, x_value), ylim=(1, -1), xlim=(0, 10), size=(8, 4), title='V-influence')


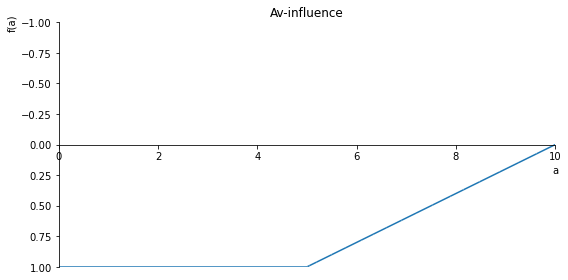
Av_inlfuence = (-sf(5, a, 1) + sf(10, a, 1))/5
sp.plot(Av_inlfuence, ylim=(1, -1), xlim=(0, 10), size=(8, 4), title= 'Av-influence')
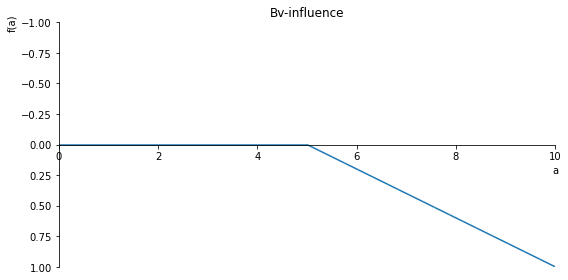
Bv_inlfuence = 1- (-sf(5, a, 1) + sf(10, a, 1))/5
sp.plot(Bv_inlfuence, ylim=(1, -1), xlim=(0, 10), size=(8, 4), title='Bv-influence')
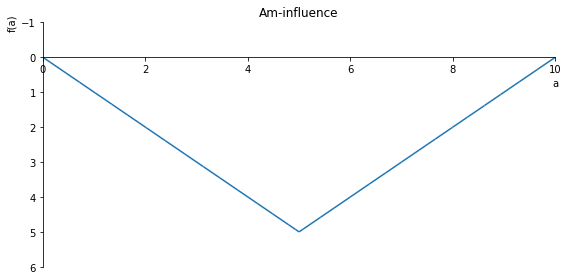
Am = -2*sf(5, a, 1) + sf(10, a, 1)
sp.plot(Am, ylim=(6, -1), xlim=(0, 10), size=(8, 4), title='Am-influence')


plt.show()
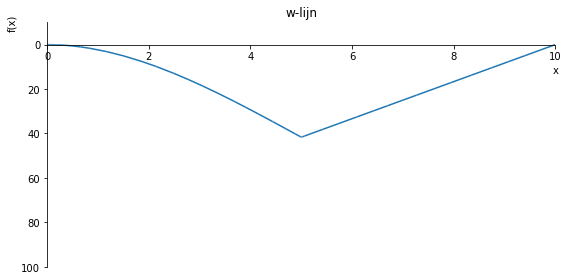
# voorbeeld 3
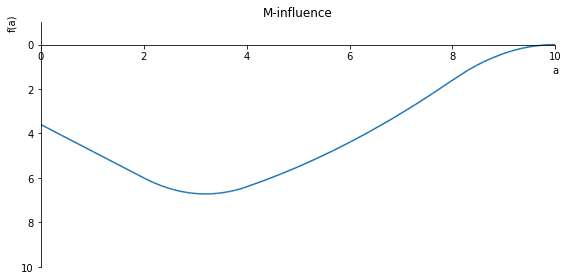
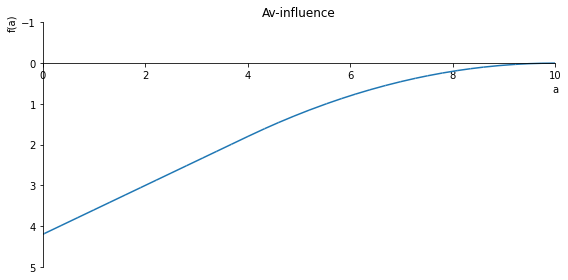
Av_influence = (sf(10, a, 2) - sf(4, a, 2))/20
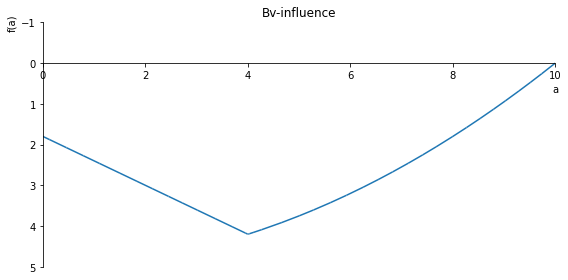
Bv_influence = sf(10, a, 1) - sf(4, a, 1) - ((sf(10, a, 2) - sf(4, a, 2))/20)
C_phi = -(5/6)*(sf(10, a, 2) - sf(4, a, 2)) + (1/240)*sf(10, a, 4) - (1/240)*sf(4, a, 4)


w_influence = (-1/6)*((sf(10, a, 2) - sf(4, a, 2))/20)*sf(x, 0, 3) + 1/24*sf(x, a, 4) - 1/24*sf(x, a+6, 4) - (1/6)*(sf(10, a, 1) - sf(4, a, 1)- ((sf(10, a, 2) - sf(4, a, 2))/20))*sf(x, 10, 3) - (-(5/6)*(sf(10, a, 2) - sf(4, a, 2)) + (1/240)*sf(10, a, 4) - (1/240)*sf(4, a, 4))*x
phi = sp.diff(w_influence, x)*-1
M = sp.diff(phi, x)
V = sp.diff(M, x)

x_value = 8
a_value = 2

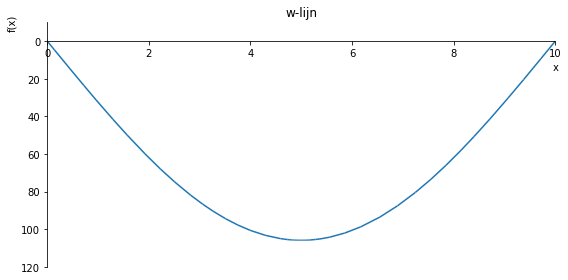
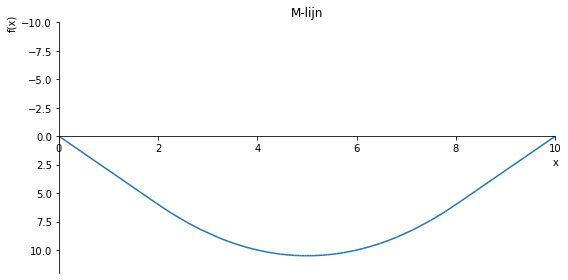
sp.plot(w_influence.subs(a, a_value), ylim=(120, -10), xlim=(0, 10), size=(8, 4), title='w-lijn')
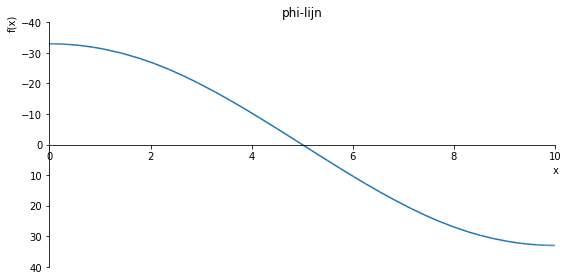
sp.plot(phi.subs(a, a_value), ylim=(40, -40), xlim=(0, 10), size=(8, 4), title='phi-lijn')
sp.plot(M.subs(a, a_value), ylim=(12, -10), xlim=(0, 10), size=(8, 4), title='M-lijn')
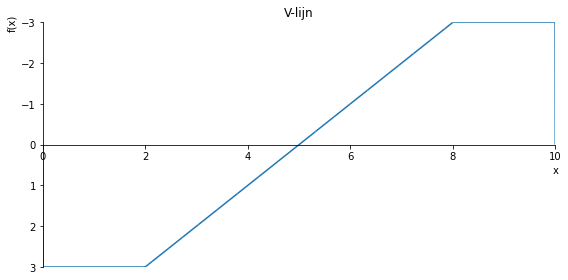
sp.plot(V.subs(a, a_value), ylim=(3, -3), xlim=(0, 10), size=(8, 4), title='V-lijn')


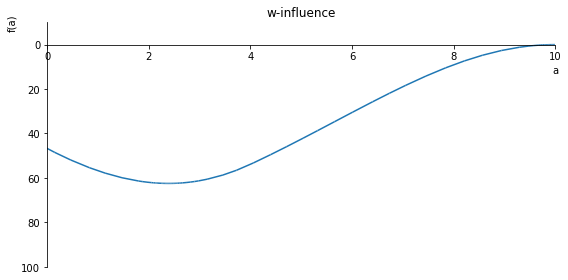
sp.plot(w_influence.subs(x, x_value), ylim=(100, -10), xlim=(0, 10), size=(8, 4), title='w-influence')
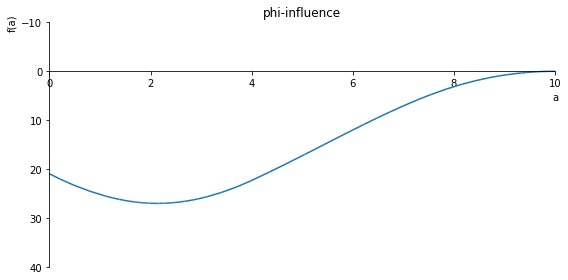
sp.plot(phi.subs(x, x_value), ylim=(40, -10), xlim=(0, 10), size=(8, 4), title='phi-influence')
sp.plot(M.subs(x, x_value), ylim=(10, -1), xlim=(0, 10), size=(8, 4), title='M-influence')
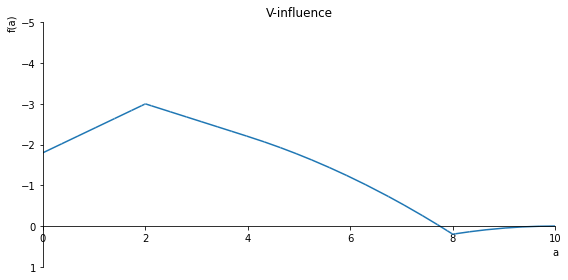
sp.plot(V.subs(x, x_value), ylim=(1, -5), xlim=(0, 10), size=(8, 4), title='V-influence')

sp.plot(Av_influence, ylim=(5, -1), xlim=(0, 10), size=(8, 4), title='Av-influence')
sp.plot(Bv_influence, ylim=(5, -1), xlim=(0, 10), size=(8, 4), title='Bv-influence')

plt.show()
# voorbeeld 4
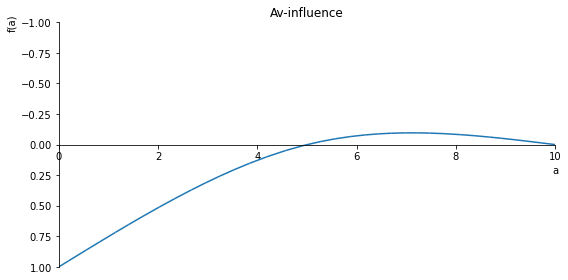
Av_influence = (1/500)*sf(10, a, 3) - (1/20)*sf(10, a, 1) - (1/250)*sf(5, a, 3)
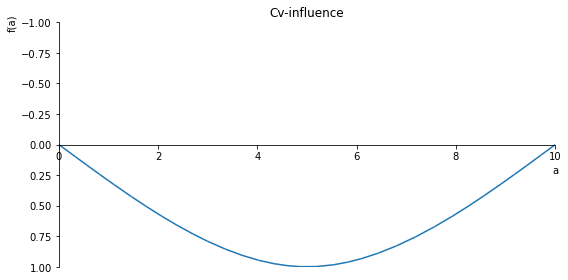
Cv_influence = -2*(Av_influence) + (1/5)*sf(10, a, 1)
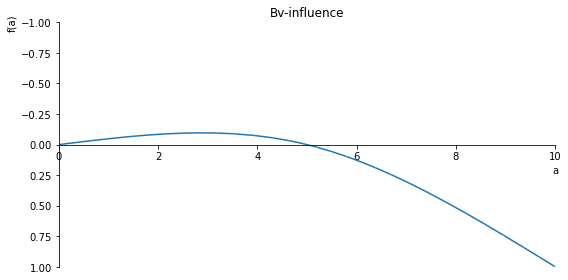
Bv_influence = 1 - Av_influence - Cv_influence
Cphi = -(25/6)*Av_influence +(1/30)*sf(5, a, 3)

w_influence = (-1/6)*(Av_influence)*sf(x, 0, 3) + (1/6)*sf(x, a, 3) - (1/6)*Cv_influence*sf(x, 5, 3) - (1/6)*Bv_influence*sf(x, 10, 3) - Cphi*x
phi = sp.diff(w_influence, x)*-1
M = sp.diff(phi, x)
V = sp.diff(M, x)

x_value = 4
a_value = 2

sp.plot(w_influence.subs(a, a_value), ylim=(2, -1), xlim=(0, 10), size=(8, 4), title='w-lijn')
sp.plot(phi.subs(a, a_value), ylim=(2, -2), xlim=(0, 10), size=(8, 4), title='phi-lijn')
sp.plot(M.subs(a, a_value), ylim=(2, -2), xlim=(0, 10), size=(8, 4), title='M-lijn')
sp.plot(V.subs(a, a_value), ylim=(1, -1), xlim=(0, 10), size=(8, 4), title='V-lijn')


sp.plot(w_influence.subs(x, x_value), ylim=(2, -1), xlim=(0, 10), size=(8, 4), title='w-influence')
sp.plot(phi.subs(x, x_value), ylim=(1, -(1/2)), xlim=(0, 10), size=(8, 4), title='phi-influence')
sp.plot(M.subs(x, x_value), ylim=(0.75, -0.5), xlim=(0, 10), size=(8, 4), title='M-influence')
sp.plot(V.subs(x, x_value), ylim=(1, -1), xlim=(0, 10), size=(8, 4), title='V-influence')


sp.plot(Av_influence, ylim=(1, -1), xlim=(0, 10), size=(8, 4), title='Av-influence')
sp.plot(Cv_influence, ylim=(1, -1), xlim=(0, 10), size=(8, 4), title='Cv-influence')
sp.plot(Bv_influence, ylim=(1, -1), xlim=(0, 10), size=(8, 4), title='Bv-influence')


plt.show()
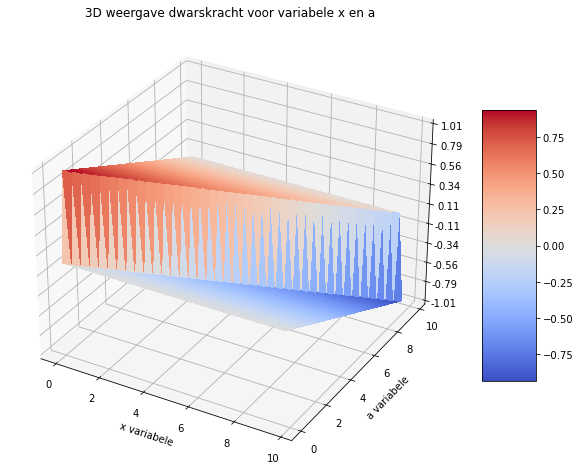
# 3D plotje

import matplotlib.pyplot as plt
import numpy as np
from matplotlib import cm
from matplotlib.ticker import LinearLocator
import sympy as sp
sf = sp.SingularityFunction

fig = plt.figure(figsize=(10, 10))
ax = fig.gca(projection='3d')

x = np.arange(0, 10, 0.25)
a = np.arange(0, 10, 0.25)
X, A = np.meshgrid(x, a)

def V(x, a):
    sf_x = np.where(x >= 0, 1, 0)
    sf_xa = np.where(x - a >= 0, 1, 0)
    sf_x10 = np.where(x - 10 >= 0, 1, 0)
    return ((10-a)/10)*1.0*sf_x - 1.0*sf_xa + (a/10)*1.0*sf_x10

Z = V(X, A)

surf = ax.plot_surface(X, A, Z, cmap=cm.coolwarm, linewidth=0, antialiased=False)
ax.set_zlim(-1.01, 1.01)
ax.zaxis.set_major_locator(LinearLocator(10))
ax.zaxis.set_major_formatter('{x:.02f}')

fig.colorbar(surf, shrink=0.5, aspect=5)

plt.xlabel('x variabele')
plt.ylabel('a variabele')
plt.title('3D weergave dwarskracht voor variabele x en a')
plt.show()
