8.1. Material characteristics#
This section contains various tables depicting the material properties of the different steel grades.
Strength and stiffness#
Property |
S235 |
S275 |
S355 |
S420 |
S460 |
|---|---|---|---|---|---|
Density \(ρ_k\) [kg/m³] |
7850 |
7850 |
7850 |
7850 |
7850 |
Young’s Modulus \(E_k\) [N/mm²] |
210 × 10³ |
210 × 10³ |
210 × 10³ |
210 × 10³ |
210 × 10³ |
Design Yield Stress \(f_{y;d}\) [N/mm²] |
235 |
275 |
355 |
420 |
460 |
Design Tensile Strength \(f_{t;d}\) [N/mm²] |
360 |
430 |
510 |
– |
– |
Yield Strain \(ε_{y;d}\) [‰] |
1.12 |
1.31 |
1.69 |
– |
– |
Shear Modulus \(G_k\) [N/mm²] |
8.1 × 10⁴ |
8.1 × 10⁴ |
8.1 × 10⁴ |
8.1 × 10⁴ |
8.1 × 10⁴ |
Coefficient of Thermal Expansion \(α\) [K⁻¹] |
12 × 10⁻⁶ |
12 × 10⁻⁶ |
12 × 10⁻⁶ |
12 × 10⁻⁶ |
12 × 10⁻⁶ |
Higher steel grades are also available (up to S1100). The design rules stated in EC3 and this section only apply for the mentioned steel grades. The given values are only applicable to plates, flanges, etc with a maximum thickness of 40 mm acciording to NEN-EN 10025.
Stress-strain diagram#
Note
\(ε_{y;d}\) : design yield strain
\(f_{t;d}\) : design tensile strength
\(f_{y;d}\) : design yield stress
tan α : E_d (Young’s modulus)
In ordinary calculation the distrubution of forces and structural checks are executed using linear elasticity. In practice this means that as soons as the steel starts to yield, the structure is assumed to have failed. Only the linear part of the diagram shown above is used. The maximum strain is limited by the values given in the material properties table.
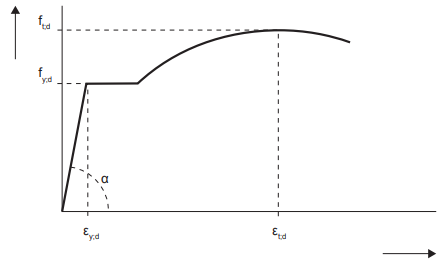
Fig. 8.1 Stress-strain diagram steel.#