3.5. Beams with multiple supports#
Beams on multiple supports (concentrated loads)#
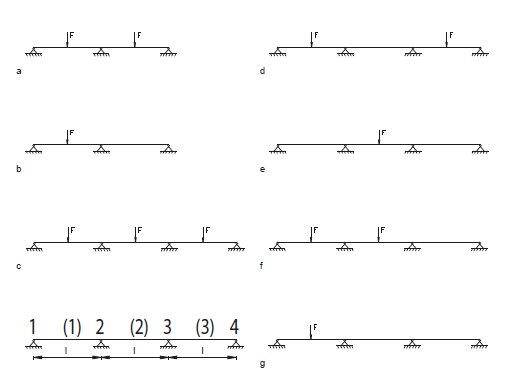
Fig. 3.13 Beams on multiple supports for concentrated loads.#
Case |
M(1) |
M2 |
M(2) |
M3 |
M(3) |
R1 |
R2 |
R3 |
R4 |
|---|---|---|---|---|---|---|---|---|---|
a |
0.1562 |
-0.1875 |
0.1562 |
0.3125 |
1.3750 |
0.3125 |
|||
b |
0.2031 |
-0.0938 |
-0.0469 |
0.4062 |
0.6876 |
-0.0938 |
|||
c |
0.1750 |
-0.1500 |
0.1000 |
-0.1500 |
0.1750 |
0.3500 |
1.1500 |
1.1500 |
0.3500 |
d |
0.2125 |
-0.0750 |
-0.0750 |
-0.0750 |
0.2125 |
0.4250 |
0.5750 |
0.5750 |
0.4250 |
e |
-0.0375 |
-0.0750 |
0.1750 |
-0.0750 |
-0.0375 |
-0.0750 |
0.5750 |
0.5750 |
-0.0750 |
f |
0.1625 |
-0.175 |
0.1375 |
-0.0500 |
-0.0250 |
0.3250 |
1.3000 |
0.4250 |
-0.0500 |
g |
0.2000 |
-0.1000 |
-0.0375 |
0.0250 |
0.0125 |
0.4000 |
0.7250 |
-0.1500 |
0.0250 |
case numbers in the tables are related to the concentrated loads working on the structure. The bending moments and support reactions in the designated points are found by multiplying the factors in the table with F x L or F.
M(1) is the maximum bending in beam (1).
M3 is the hogging moment located at support 3.
R2 is the support reaction in support 2.
Example
For situation c:
\(F = 30 kN\)
\(L = 8 m\)
The calculations are as follows:
\(M(1) = 0.175 * 30 * 8 kNm\)
\(M3 = -0.15 * 30 * 8 kNm\)
\(R2 = 1.15 * 30 kN\)
Beams on multiple supports (distributed load)#
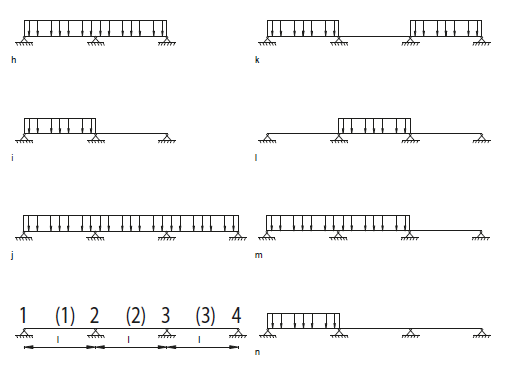
Fig. 3.14 Beams on multiple supports for distributed loads.#
Case |
M(1) |
location rel. to 1* |
M2 |
M(2) |
location rel. to 2** |
M3 |
M(3) |
R1 |
R2 |
R3 |
R4 |
|---|---|---|---|---|---|---|---|---|---|---|---|
h |
0.0703 |
0.3750 |
-0.1250 |
0.0703 |
0.6250 |
0.3750 |
1.2500 |
0.3750 |
|||
i |
0.0957 |
0.4375 |
-0.0625 |
-0.0313 |
0.4375 |
0.6250 |
-0.0625 |
||||
j |
0.0800 |
0.4000 |
-0.1000 |
0.0250 |
0.5000 |
-0.1000 |
0.0800 |
0.4000 |
1.1000 |
1.1000 |
0.4000 |
k |
0.1013 |
0.4500 |
-0.0500 |
-0.0500 |
-0.0500 |
0.1013 |
0.4500 |
0.5500 |
0.5500 |
0.4500 |
|
l |
-0.025 |
-0.0500 |
0.0750 |
0.5000 |
-0.0500 |
-0.0500 |
0.5500 |
0.5500 |
-0.0500 |
||
m |
0.0735 |
0.3833 |
-0.1167 |
0.0535 |
0.5830 |
-0.0333 |
0.3833 |
1.2001 |
0.4499 |
-0.0333 |
|
n |
0.0939 |
0.4333 |
-0.0667 |
-0.0250 |
0.0167 |
0.4333 |
0.6501 |
-0.1001 |
0.0167 |
*) location of bending moment M(1) in relation to support 1 (distance = factor x L)
**) location of bending moment M(2) in relation to support 2 (distance = factor x L)
The numbers in the tables are related to the concentrated loads working on the structure. The bending moments and support reactions in the designated points are found by multiplying the factors in the table with \(q * L^2\) or \(q * L\).
M(1) is the maximum bending in beam (1).
M3 is the hogging moment located at support 3.
R2 is the support reaction in support 2.
Example
For situation m:
\(q = 5 kN/m\)
\(L = 6 m\)
The calculations are as follows:
\(M(1) = 0,0735 * 5 * 62 \ kNm\)
\(M3 = -0,0333 * 5 * 62 \ kNm\)
\(R2 = 1,2001 * 5 * 6 \ kN\)
The M, V and displacement diagrams for the above situations can be found below. Multiply the factors in the diagrams with \(q * L\) to calculate V, with \(q * L^2\) to calculate M and with \(q * L^4 / EI\) to find the deformation.
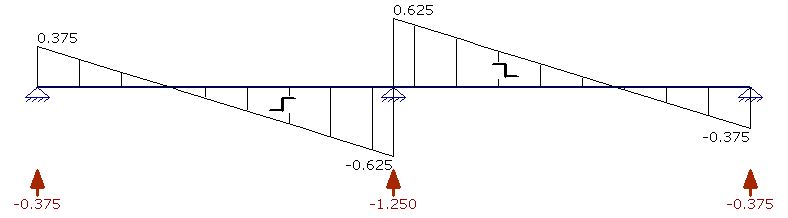
Fig. 3.15 Shear force diagram beam on 3 support points under equally distributed load (case h from the figure above).#
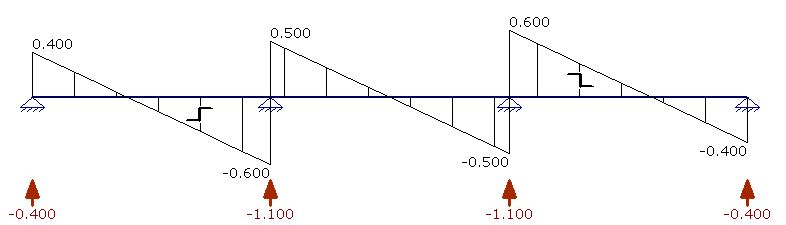
Fig. 3.16 Shear force diagram on 4 support points under equally distributed load (case j from the figure above).#
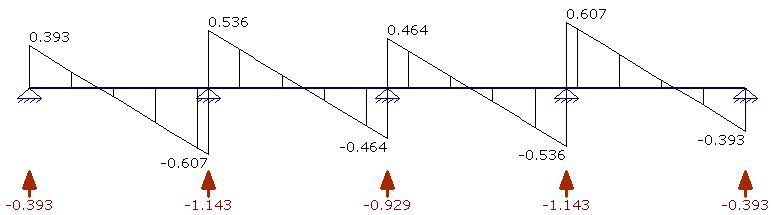
Fig. 3.17 Shear force diagram on 5 support points under equally distributed load.#
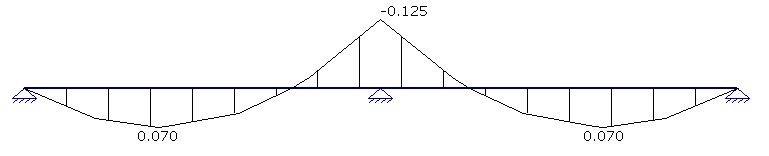
Fig. 3.18 Moment diagram beam on 3 support points under equally distributed load (case h from the figure above).#
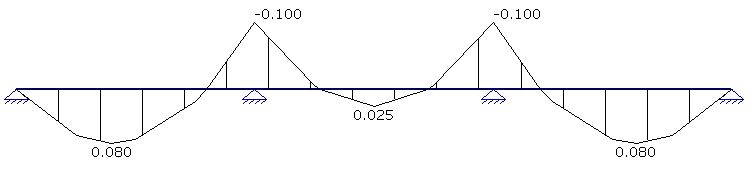
Fig. 3.19 Moment diagram beam on 4 support points under equally distributed load (case j from the figure above).#
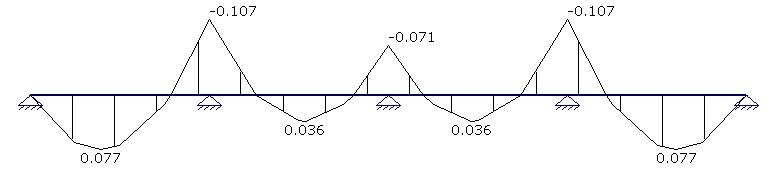
Fig. 3.20 Moment diagram beam on 5 support points under equally distributed load.#
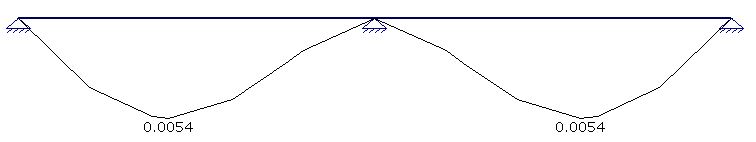
Fig. 3.21 Deformation diagram beam on 3 support points under equally distributed load (case h from the figure above).#
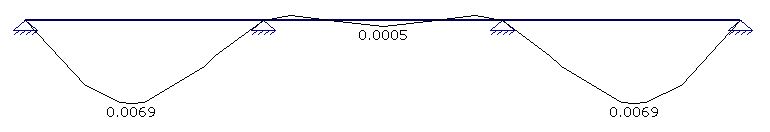
Fig. 3.22 Deformation diagram beam on 4 support points under equally distributed load (case j from the figure above).#
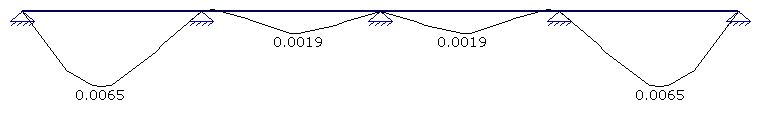
Fig. 3.23 Deformation diagram beam on 5 support points under equally distributed load.#